|
 |
 |
  |
 |
| |
 |
 |
|
| |
ABOUT INTERNATIONAL POWER WE ARE AN INTERNATIONAL WHOLESALE POWER
GENERATOR AND DEVELOPER WITH INTERESTS IN 12 COUNTRIES COVERING FOUR
CONTINENTS. FOR REPORTING PURPOSES WE ORGANISE OUR BUSINESS INTO
FIVE SEGMENTS: NORTH AMERICA, EUROPE, MIDDLE EAST, AUSTRALIA AND
REST OF THE WORLD.
Our businessInternational Power owns, controls or operates more
than 16,000 MW of generating capacity worldwide.
Formed in October 2000 by the demerger of National
Power, International Power is currently listed on the
London and New York Stock Exchanges. Since demerger,
we have increased our international presence by building
new generating assets in the US, Oman and the UAE
and through the acquisition of plants in Australia, the
UAE and the UK.
We generate electricity from gas, oil, coal and
renewable energy sources. We also maximise value
through complementary activities. These include
mining coal and transporting gas by pipeline in Australia,
desalinating water in the Middle East and providing steam
for district heating systems in Europe. Some of the power
we generate is sold to customers through competitive
merchant markets. The remainder is sold to single
customers under long-term power purchase agreements.
Environmental care is an integral part of all our
operations. New initiatives range from developing our
first wind farm in Australia to increasing our capability to
burn more environmentally friendly fuels in our
UK coal-fired power station.
The corporate social responsibility section sets out how we manage environmental
impacts and our relationship with the communities in
which we operate.
Our strategy
We aim to create value in wholesale power generation
through operating our existing asset portfolio efficiently,
trading output competitively and growing the business in
our core regions of North America, Europe, the Middle
East and Australia. We aim to maintain a balanced
portfolio of assets in terms of fuel diversity, dispatch type,
geographical spread and participation in both merchant
markets and long-term contracts.
We have the people, the resources and the determination
to deliver for the benefit of all our shareholders
and stakeholders.
Our core skills
We operate in a capital-intensive industry where
financing expertise optimises the funding structure for
all our assets and investments. Growth comes from a
mixture of development projects and acquisitions. We
have a co-ordinated corporate and regional approach
to the sourcing, selection and evaluation of acquisition
opportunities. Robust technical, commercial and financial
criteria ensure our capital is used wisely.
Long-term success depends on the quality of the
development opportunities we secure. We have been
particularly successful in the Middle East, where longterm
off-take agreements significantly balance risk in
developing and building new capital-intensive plant. Our
development, construction management and commercial
skills are essential for ensuring satisfied customers and
sound financial returns.
Our business requires maximum plant availability,
particularly at times of peak demand, and our
experienced operations and engineering personnel
help us deliver at these times of significant value.
There is close integration between operations and
trading teams in all our core regions to ensure speed
and flexibility of response to market conditions. Our
fuel procurement teams are responsible for co-ordinating
our gas, coal and oil supply with the demands of our
power generation profile. |
|
| |
|
|
| |
 |
|
| |
|
|
|
|
| |
|
|
| |
| |
 |
North America |
|
|
| |
Year ended
31 December
2003 |
Year ended
31 December
2002 |
|
 |
| |
£m |
£m |
| Turnover |
414 |
315 |
|
| PBIT (pre-exceptional items) |
2 |
99 |
| Exceptional items |
(404) |
- |
|
| PBIT |
(402) |
99 |
|
|
|
| |
|
|
| |
Weak wholesale prices impacted our financial performance in North America during 2003. Gross turnover in North America increased to £414 million from £315 million in 2002, as all plants were operational during 2003. However, 2003 profit before interest and tax decreased to £2 million from £99 million in 2002, due to a combination of low spark spreads and declining compensation payments from Alstom.
In light of recent trading conditions and future price
forecasts in the ERCOT (Texas) and NEPOOL (New England) markets, we reviewed the balance sheet book
values of the US merchant plants (Hays, Midlothian,
Blackstone, Bellingham and Milford). This review resulted
in an impairment of these assets by an aggregate amount
of £404 million. The revised net book value of these
assets totals £600 million.
Given uncertainty in the ability of these merchant
assets to meet all future costs including interest
payments, our US subsidiary, ANP Funding 1, has
proactively approached its US bank group to renegotiate
the terms of its non-recourse project finance in order
to provide an appropriate long-term financing structure.
Discussions with the bank group will examine a wide
range of options. As we are also in discussion with the
US bank group regarding certain claimed technical
events of default, this non-recourse debt is disclosed
as current debt in our accounts.
Due to uneconomic prices, we mothballed our modern
1,100 MW combined cycle gas turbine (CCGT) Hays power
station in Texas in January 2004, for an indefinite period. |
|
| |
|
|
| |
| |
|
|
|
|
|
| |
Fuel / Type |
Gross
capacity
power
MW |
Net
capacity2
power
MW |
Gross
capacity
heat
(MWth) |
Net
capacity2
heat
(MWth) |
| Assets in operation |
|
|
|
|
|
| Hartwell, Georgia |
Gas (OCGT) |
310 |
155 |
– |
– |
| Oyster Creek, Texas |
Gas (Cogen/CCGT) |
425 |
213 |
100 |
50 |
| Hays, Texas1.3 |
Gas (CCGT) |
1,100 |
1,100 |
– |
– |
| Midlothian I and II, Texas1 |
Gas (CCGT) |
1,650 |
1,650 |
– |
– |
| Blackstone, Massachusetts1 |
Gas (CCGT) |
570 |
570 |
– |
– |
| Milford, Massachusetts |
Gas (CCGT) |
160 |
160 |
– |
– |
| Bellingham, Massachusetts1 |
Gas (CCGT) |
570 |
570 |
– |
– |
| North America total in operation |
4,785 |
4,418 |
100 |
50 |
|
|
| |
|
|
| |
(1) Capacity shown for these assets is the nameplate capacity.
(2) Net capacity is the Group share of gross capacity.
(3) The generation capacity at Hays was mothballed in January 2004. |
|
| |
|
|
| |
|
|
| |
|
|
|
|
| |
| |
Europe |
|
|
| |
Year ended
31 December
2003 |
Year ended
31 December
2002 |
|
|
| |
£m |
£m |
| Turnover |
474 |
440 |
|
| PBIT (pre-exceptional items) |
103 |
100 |
| Exceptional items |
7 |
(103) |
|
| PBIT |
110 |
(3) |
|
|
|
| |
|
|
| |
All our European assets delivered a strong operational
performance last year. Turnover increased by 8% to
£474 million, principally supported by the performance
of the contracted assets in this region. Our long-term
contracted assets in Portugal and Turkey delivered
excellent financial performance, and coupled with a
record profit performance from EOP in the Czech
Republic, offset the weak market conditions in the
UK and helped the region generate profit before
interest and tax of £103 million (2002: £100 million).
Overall profitability in the UK was lower than last
year due to the termination of the tolling agreement
at Rugeley (with TXU Europe) in November 2002 and
weak wholesale prices during much of 2003. Following
the termination of the tolling contract, the existing
£160 million non-recourse debt facility for Rugeley was
renegotiated and reduced to £90 million in August 2003.
We continue to discuss appropriate compensation with
TXU Europe's administrators, but at present we are
unable to forecast the timing of a resolution.
In the UK, in order to provide additional support for our
contracted capacity during the winter period, we returned
the 250 MW mothballed unit at the Deeside plant to
service in October 2003.
Although UK wholesale prices showed some
improvement in the second half of 2003, significant
increases in gas and coal prices quickly eroded this
benefit. Despite these tough market conditions, we see potential opportunities to add value by consolidating our
position in the UK and we will continue to review market
developments carefully.
In January 2004, the UK government announced draft
carbon dioxide emission allocations and commenced
industry consultation to finalise the position by the end
of September this year. The draft allocations for Rugeley
and Deeside were broadly in line with our expectations.
Carbon dioxide allocations are an important factor in
deciding whether the fitting of flue gas desulphurisation
(FGD) at Rugeley is economic. This decision will be made
in June 2004 when we decide on our plans for Rugele under the Large Combustion Plant Directive (LCPD).
EOP and Pego are well placed to meet their
requirements under the LCPD. FGD is already fitted
at EOP, and plans are underway to build FGD at Pego
during 2006.
The Portuguese government has commenced discussions
with incumbent generators to make changes to existing
long-term Power Purchase Agreements (PPAs). These
discussions are targeted to enable the Portuguese market
to integrate with the new liberalised Iberian wholesale
power market that is due to commence operation in
2006. These discussions are at an early stage and are
likely to continue into the second half of 2004. We
believe that the government intends to preserve the value
in these contracts and therefore we expect to be kept
economically whole through this process.
In February 2004, we disposed of our stake in Elcogas,
Spain. This investment had been fully provided against,
and the release of a guarantee will result in an
exceptional gain in Q1 2004.
To reflect our current management structure we
now report the results of our Middle East business as
a separate region rather than with the European
business results, as reported last year. |
|
| |
|
|
| |
| |
|
|
|
|
|
| |
Fuel / Type |
Gross
capacity
power
MW |
Net
capacity1
power
MW |
Gross
capacity
heat
(MWth) |
Net
capacity1
heat
(MWth) |
| Assets in operation |
|
|
|
|
|
| EOP, Czech Republic2 |
Coal/Gas |
585 |
580 |
1,945 |
1,925 |
| Deeside, UK |
Gas (CCGT) |
500 |
500 |
|
|
| Rugeley, UK |
Coal (50 MW of OCGT) |
1,050 |
1,050 |
|
|
| Tejo Energia (Pego), Portugal |
Coal |
600 |
270 |
|
|
| Uni-Mar (Marmara), Turkey |
Gas (CCGT) |
480 |
160 |
|
|
| Europe total in operation |
3,215 |
2,560 |
1,945 |
1,925 |
|
|
| |
|
|
| |
(1) Net capacity is the Group share of gross capacity.
(2) Gross capacity amount shown for EOP represents the actual net interest owned directly or indirectly by EOP. |
|
| |
|
|
| |
|
|
| |
|
|
| |
Middle East |
|
|
| |
Year ended
31 December
2003 |
Year ended
31 December
2002 |
|
|
| |
£m |
£m |
| Turnover |
33 |
- |
|
| PBIT (pre-exceptional items) |
23 |
9 |
| Exceptional items |
- |
- |
|
| PBIT |
23 |
9 |
|
|
|
| |
|
|
| |
Turnover rose to £33 million (2002: £nil) and operating
profit increased to £23 million (2002: £9 million)
as a result of the acquisition of Umm Al Nar and the
commencement of operations at Al Kamil.
In April, together with our partners TEPCO and Mitsui,
we acquired a 20% interest in Umm Al Nar, a large
power and water desalination plant. The acquisition is
backed by a 23-year Power and Water Purchase
Agreement (PWPA) with the Abu Dhabi Water and
Electricity Company. In July, a US$1.77 billion nonrecourse
funding package was secured to fund the
acquisition and the associated plant expansion project.
Since acquisition, the plant has delivered robust financial
and operational performance.
In December, together with our partner Saudi Oger,
we signed an agreement with Saudi Aramco to develop,
own and operate four cogeneration plants in Saudi
Arabia. These facilities will have a total capacity of
1,074 MW and be capable of producing 4.5 million
lbs/hr of steam. They are expected to commence
operation on a phased basis between March and
December 2006. On completion the plants will supply
power and steam to Saudi Aramco under 20-year Energy
Conversion Agreements. International Power owns 60%
of the project company, with Saudi Oger holding the
remaining 40%.
In February 2004, the financing for the Saudi Aramco
cogeneration projects was completed. The financing
comprises a non-recourse US$510 million facility that
has a 17-year term. International Power's total equity
commitment to the projects amounts to US$78 million.
The construction of the Shuweihat S1 power and water
plant in Abu Dhabi is progressing and the plant is
expected to commence operation in Q4 2004. The first
two of five gas turbines and the first of six multi-stage
flash desalination units have been successfully
commissioned.
|
|
| |
|
|
| |
| |
|
|
|
|
|
| |
Fuel / Type |
Gross
capacity
power
MW |
Net
capacity1
power
MW |
Gross
capacity
heat
(MWth)
desal
(MIGD)
steam
(millions
lbs/hr)
|
Net
capacity1
heat
(MWth)
desal
(MIGD)
steam
(millions
lbs/hr) |
| Assets in operation |
|
|
|
|
|
| Al Kamil, Oman |
Gas (OCGT) |
285 |
285 |
|
|
| Arabian Power Company |
|
|
|
|
|
| (Umm Al Nar), UAE |
Gas (CCGT)/desalination |
870 |
174 |
162 MIGD |
32 MIGD |
| Middle East total in operation |
1,155 |
459 |
162 MIGD |
32 MIGD |
| |
|
|
|
|
|
| Assets under construction |
|
|
|
|
| Arabian Power Company |
|
|
|
|
|
| (Umm Al Nar expansion), UAE |
Gas (CCGT)/desalination |
1,550 |
310 |
25 MIGD |
5 MIGD |
| Shuweihat S1, UAE |
Gas (CCGT)/desalination |
1,500 |
300 |
100 MIGD |
20 MIGD |
| Saudi Aramco Cogen Projects, |
|
|
|
|
|
| Saudia Arabia |
Gas (Cogen) |
1,074 |
644 |
4.5m lbs/hr |
2.7m lbs/hr |
| Middle East total under construction |
4,124 |
1,254 |
|
|
|
|
| |
|
|
| |
(1) Net capacity is the Group share of gross capacity. |
|
| |
|
|
| |
|
|
| |
|
|
|
|
| |
| |
Australia |
|
|
| |
Year ended
31 December
2003 |
Year ended
31 December
2002 |
|
|
| |
£m |
£m |
| Turnover |
224 |
226 |
|
| PBIT (pre-exceptional items) |
101 |
101 |
| Exceptional items |
- |
- |
|
| PBIT |
101 |
101 |
|
|
|
| |
|
|
| |
Reflecting the strength of our contracted position in
Australia, turnover at £224 million (2002: £226 million),
and operating profit at £101 million (2002: £101 million)
were both flat when compared to 2002, despite relatively
lower market prices in 2003. We continue to retain a
strong forward contracted position through 2004.
Work is underway to further develop the open cast
coal mine at Hazelwood. This project will extend the life
of the mine and will provide coal reserves to support
generation at Hazelwood until the end of 2009. The
Hazelwood turbine upgrade programme is progressing
well and is expected to increase the plant's peak capacity
from 1,610 MW to 1,740 MW by 2007.
Construction of the 687km SEA Gas pipeline was
completed on 1 January 2004 on schedule and on
budget. The pipeline will be used to transport gas from
the Minerva gas field in Victoria by Q4 2004.
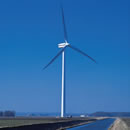
We are pleased to report that we have secured our
first wind power project at Canunda in South Australia.
Construction of this 46 MW plant is expected to start
in Q2 of this year, with a view to commencing
commercial operation in Q2 2005. Power from this plant
will be sold under a 10-year long-term contract to AGL,
Australia's largest energy retailer. With the addition of
Canunda, our Australian portfolio is now well balanced
with good fuel diversity, ranging from fossil fired (brown
coal and efficient gas-fired) through to wind power.
|
|
| |
|
|
| |
| |
|
|
|
| |
Fuel / Type |
Gross
capacity
power
MW |
Net
capacity1
power
MW |
| Assets in operation |
|
|
|
| Hazelwood, Victoria |
Coal |
1,610 |
1,480 |
| Synergen, South Australia |
Various (OCGT) |
360 |
360 |
| Pelican Point, South Australia |
Gas (CCGT) |
485 |
485 |
| SEA Gas pipeline, South Australia2 |
|
n/a |
n/a |
| Australia total in operation |
2,455 |
2,325 |
|
|
| |
|
|
| |
(1) Net capacity is the Group share of gross capacity.
(2) 687km gas pipeline from Victoria to South Australia. |
|
| |
|
|
| |
|
|
| |
|
|
|
|
| |
| |
Rest of the World |
|
|
| |
Year ended
31 December
2003 |
Year ended
31 December
2002 |
|
|
| |
£m |
£m |
| Turnover |
128 |
148 |
|
| PBIT (pre-exceptional items) |
84 |
108 |
| Exceptional items |
55 |
42 |
|
| PBIT |
139 |
150 |
|
|
|
| |
|
|
| |
Our plants in the Rest of the World have delivered
steady performance over the past year, with turnover
of £128 million (2002: £148 million) and profit before
interest and tax at £84 million (2002: £108 million).
Both of our investments in Pakistan (HUBCO and
KAPCO) continue to perform well. We have sold a
5% shareholding in HUBCO in line with our policy of
selectively monetising investments at the appropriate time
generating cash of £21 million. Our equity interest in
HUBCO now totals 20.7%. We have booked an exceptional gains of £52 million, reflecting the profit on this sale and
the reversal of a previous impairment provision.
Malakoff made two acquisitions in Malaysia in 2003. It
acquired 100% of Prai Power, a 350 MW CCGT plant
and 90% of the equity interest in Tanjung Bin, a 2,100 MW
coal-fired plant. Both acquisitions are backed by long-term
PPAs with Tenaga Nasional Berhad, Malaysia's leading
utility.
Our 110 MW plant in Thailand sells the majority of
its power under a long-term contract to the Electricity
Generating Authority of Thailand with the remainder
of its output being sold to local industrial customers. In
2003, the plant benefited from increased retail sales to its
industrial customers due to the acceleration of economic
growth in Thailand, which looks set to continue.
In 2003 we concluded our divestments in China,
realising an exceptional gain of £3 million. |
|
| |
|
|
| |
| |
|
|
|
|
|
| |
Fuel / Type |
Gross
capacity
power
MW |
Net
capacity1
power
MW |
Gross
capacity
heat
(MWth) |
Net
capacity1
heat
(MWth) |
| Assets in operation |
|
|
|
|
|
| Malakoff, Malaysia2 |
Gas (OC/CCGT) |
1,895 |
355 |
– |
– |
| Thai National Power |
|
|
|
|
|
| (Pluak Daeng), Thailand |
Gas (Cogen) |
110 |
110 |
20 |
20 |
| HUBCO, Pakistan |
Oil |
1,290 |
270 |
– |
– |
| KAPCO, Pakistan |
Gas/Oil (CCGT) |
1,600 |
575 |
– |
– |
| Rest of the World total in operation |
4,895 |
1,310 |
20 |
20 |
| |
|
|
|
|
|
| Assets under construction |
|
|
|
|
| Malakoff, Malaysia2 |
Coal |
1,890 |
355 |
|
|
| Rest of the World under construction |
1,890 |
355 |
|
|
|
|
| |
|
|
| |
(1) Net capacity is the Group share of gross capacity.
(2) Gross capacity amount shown for Malakoff represents the actual net interest owned directly or indirectly by Malakoff. |
|
| |
|
|
| |
|
|
| |
|
|
|
 |
|
|
|
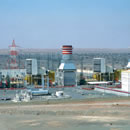
Lumut power plant Malakof, Malasia |
|
| |
| |
 |
|
| |
Our clear immediate priority is the successful
restructuring of the US business and we are focused on
finding a solution that provides value for our shareholders.
Alongside our drive to deliver value from our existing
asset base, we continue to review a range of growth
opportunities in our core markets.
Our earnings per share guidance for 2004 remains
7p to 9p.

Corporate costs
The Group operates from corporate offices in London
and Swindon, where corporate and business functions are
based to support our worldwide operations. Continued
cost control resulted in the cost of providing these services
being reduced to £28 million (2002: £29 million).
In addition, the Group operates regional business support
offices in the US, Australia, the Czech Republic, Italy,
Japan and the UAE.
These offices vary in size dependent on the scale of
operations in the region, and apart from the US and
Australia, are primarily focused on business development.
Exceptional items
During the year, the Group recorded two operating
exceptional items:- impairment of US plant by £404 million;
- reversal of past impairment of our HUBCO investment
by £35 million.
The carrying values of our US plant were reviewed
following the sharp decline in both current and forward
electricity prices in the ERCOT and NEPOOL markets
in the US. This resulted in impairment of our US
merchant plants (Hays, Midlothian, Blackstone,
Bellingham and Milford).
The revised US book values were determined by applying
a risk adjusted discount rate of 9.7% to the post-tax cash
flows expected from the plants over their remaining
useful lives.
Additionally during the year, the Group recorded the
following three non-operating exceptional items:
- profit on disposal of a 5% holding in HUBCO
of £17 million;
- profit on disposal of a Czech fixed asset investment
of £7 million;
- proceeds and a gain relating to China exit of £3 million.
Net interest
Net interest payable for the year ended 31 December
2003 was £111 million (excluding exceptional items).
Corporate and subsidiary operations accounted for
interest payable of £79 million comprising gross interest
of £123 million on bonds, bank loans and overdrafts
offset by £23 million interest receivable, foreign exchange
gains of £19 million and by capitalised interest of
£2 million. Associates and joint ventures incurred net
interest payable of £32 million. Consolidated interest
cover was 2.6 times (excluding exceptional items).
Additionally during 2003, the Group recorded an exceptional interest charge of £16 million in relation to the write-off of unamortised facility costs in the US and the UK.
Tax
The tax charge for the year (pre-exceptional items)
amounted to £54 million compared to £77 million in the
previous year. The tax charge represents an effective tax
rate of 31%, compared to 30% in the prior period.
Additionally during 2003, the Group recorded an
exceptional tax credit of £26 million relating to a net
write back of deferred tax following the impairment of
the US plant. |
|
| |
|
|
| |
|
|
| |
|
|
| |
 |
|
| |
LiquidityA summarised, reclassified presentation of the Group cash flow is set out below: |
|
| |
|
|
| |
| |
Year ended
31 December
2003 |
Year ended
31 December
2002 |
|
|
| |
£m |
£m |
| Operating (loss)/profit |
(279) |
105 |
| Impairment of plant |
404 |
103 |
|
| |
125 |
208 |
| Depreciation and amortisation |
109 |
112 |
| Dividends from joint ventures and associates |
68 |
84 |
| Dividends received from fixed asset investments – ordinary |
33 |
31 |
| Movement in working capital and provisions |
(50) |
(44) |
|
| Operating cash flow |
285 |
391 |
| Capital expenditure – maintenance |
(64) |
(48) |
| Tax and interest paid |
(96) |
(108) |
| Exceptional items: |
|
|
| Dividends received from fixed asset investments |
– |
42 |
| Refinancing charges |
(4) |
(25) |
|
| Free cash flow |
121 |
252 |
| Capital expenditure – growth |
(57) |
(98) |
| Capital expenditure – other financial investment |
(9) |
– |
| Compensation for long-term performance shortfalls |
56 |
– |
| Acquisitions and disposals (2003 - exceptional) |
35 |
(144) |
| Share buyback |
(13) |
– |
| Foreign exchange, hedging and other |
(13) |
75 |
|
| Decrease in net debt |
120 |
85 |
| Opening net debt |
(812) |
(897) |
|
| Closing net debt |
(692) |
(812) |
|
|
|
| |
|
|
| |
Operating cash flow for the year ended 31 December 2003 decreased by 27% to £285 million as compared to
£391 million for the year ended 31 December 2002. The principal reasons include lower operating profit performance
from the US and the UK and a reduction in dividend receipts from joint ventures and associates. Capital expenditure to
maintain the operating capacity of our power stations has increased compared with the previous year, reflecting the
completion of our new build capacity in Massachusetts and Texas in 2002. Capital expenditure to increase our operating
capacity amounted to £57 million as compared to £98 million in the previous year, reflecting spend on the build of our
US and Al Kamil plants. During the year ended 31 December 2003, the Group received £56 million from contractors in
relation to compensation for plants not achieving the long-term performance levels specified in the original contracts.
Net interest of £79 million (2002: £88 million) was paid in the year reflecting a small reduction in average debt levels
over the course of the year, together with a slightly lower average cost of debt. Additionally, debt issue costs totalling
£3 million are also included within the interest line. Net tax payments in the year were £14 million (2002: £20 million).
Acquisitions and disposals principally comprise of cash receipts from the sale of a 5% holding in HUBCO and from the
sale of our investment in VCE (Czech Republic). |
|
| |
|
|
| |
|
|
| |
|
|
| |
Balance sheetA summarised, re-classified presentation of the Group balance sheet is set out below: |
|
| |
|
|
| |
| |
Year ended
31 December
2003 |
Year ended
31 December
2002 |
|
|
| |
£m |
£m |
| Fixed assets |
|
|
| Intangibles and tangibles |
2,049 |
2,474 |
| Investments |
538 |
507 |
|
| Total fixed assets |
2,587 |
2,981 |
| Net current liabilities (excluding short-term debt) |
(90) |
(138) |
| Provisions and creditors due after more than one year |
(243) |
(262) |
| Net debt |
(692) |
(812) |
|
| Net assets |
1,562 |
1,769 |
|
| Gearing |
44% |
46% |
| Debt capitalisation |
31% |
31% |
|
|
|
| |
|
|
| |
Net assets at 31 December 2003 decreased by £207 million to £1,562 million, as compared with £1,769 million at the
end of the previous year. The significant impacts on net assets in the year were a reduction in fixed assets of £404 million
following the US impairment, an increase of £35 million in investments following the reversal of the HUBCO impairment
and a reduction in tax creditors of £27 million following a net deferred tax write back following the US impairment.
Net debt at 31 December 2003 of £692 million is down from £812 million at 31 December 2002. This reflects the
strong operating cash flow of the business and the positive impact of translation of net debt balances denominated in
foreign currencies, offset by the write-off of unamortised facility fees in the US. Net debt at 31 December 2003 is
shown net of facility fees of £15 million, which have been capitalised and offset against the debt in accordance with
accounting standard FRS 4.
In addition, net assets were also impacted by a net gain of £15 million arising on the retranslation of our net investment
in foreign entities offset by a reduction of £13 million as a result of the share buyback programme.
|
|
| |
|
|
| |
Net debt and capital structure
Group net debt at 31 December comprised: |
|
| |
|
|
| |
| |
2003 |
2002 |
|
|
| |
£m |
£m |
| Cash and liquid resources |
743 |
842 |
| Euro dollar bonds |
– |
(37) |
| Convertible bond |
(200) |
(231) |
| Loans (non-recourse) |
(1,235) |
(1,386) |
|
| |
(692) |
(812) |
|
|
|
| |
|
|
| |
The above net debt of £692 million excludes the Group's share of joint ventures' and associates' net debt of £712 million
(2002: £503 million). These obligations are generally secured by the assets of the respective joint venture or associate
borrower and are not guaranteed by International Power plc or any other Group company. In view of the significance of
this amount, it has been disclosed separately. |
|
| |
|
|
| |
|
|
| |
|
|
|
 |
|
|
|
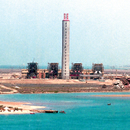
Pego, Tejo Energia Portugal |
 |
|
| |
| |
The Group has sufficient credit facilities in place to
fund and support adequately its existing operations and
to finance the purchase of new assets. These facilities
comprise a revolving credit facility for US$450 million
(expiry October 2006), the portion of the existing
convertible bond for US$103 million not 'put' by
bond holders (maturing November 2005), and a new
convertible bond for US$252 million (maturing August
2023 but with bondholders having the right to 'put' the
bond back to the Group in August 2010, 2013, 2018
and 2023). In addition, the Group has uncommitted
bilateral credit lines from various banks at its disposal
at the corporate level.
Secured non-recourse finance
The Group's financial strategy is to finance its assets
by means of limited or non-recourse project financings
at the asset or intermediate holding company level,
wherever that is practical. As part of this strategy, we
refinanced EOP in the Czech Republic, increasing the
facility to Czk 3,000 million and extending the
maturity to 2007.
The non-recourse debt at Rugeley of £160 million, which
was in technical default at the beginning of the year, was
successfully renegotiated in August 2003 and the debt
maturity reinstated to 2008 for a reduced amount of
£90 million. In May 2003 at American National Power
(ANP), our US bank group waived all claimed technical
defaults on our US non-recourse financing and therefore
this debt was redesignated to its original maturity at
30 June 2003. However, in the fourth quarter our US
banks claimed further technical defaults on this financing.
Therefore as these issues were not formally resolved at
31 December 2003, the debt at ANP has been reported
as current non-recourse debt in our accounts.
In line with all non-recourse finance, any support to the
ANP facility would be entirely discretionary, and would
not have a material impact on the Group's liquidity or
investment capability.
During 2003 both Standard & Poors and Moody's
reviewed the credit rating of our wholly owned
subsidiary ANP and this resulted in a downgrade to
below investment grade. This in itself is not an act of
default on the ANP facility, although it does increase
the interest margin of the outstanding debt.
Corporate and Group debt
Apart from the ANP facility, which is reclassified
as current, there are no major debt maturities at
Corporate or Group level in 2004. Significant new capital
expenditure on growth projects will be financed from
existing cash resources, drawing down on bank lines or
issuing new fixed rate debt, depending on market
conditions at the time.
On 31 December 2003, we had aggregated debt
financing of £1,435 million denominated principally in
US dollars, Australian dollars, sterling, Czech koruna and
Thai baht. Of this amount £531 million is due for
repayment in 2004, with the majority of the remaining
balance due after 2008. This short-term debt includes
the ANP facility already discussed in this section. |
|
| |
|
|
| |
|
|
|
|
| |
| |
|
|
| |
 |
|
| |
Treasury policy seeks to ensure that adequate financial resources are available for the development of the Group's business whilst managing its currency, interest rate and counterparty credit risks. The Group's treasury policy is not to engage in speculative transactions. Group treasury acts within clearly defined guidelines that are approved by the Board. The major areas of treasury activity are set out below.
Currency translation exposure
In common with other international companies, the results of the Group's foreign operations are translated into sterling at the average exchange rates for the period concerned. The balance sheets of foreign operations are translated into sterling at the closing exchange rates. This translation has no impact on the cash flow of the Group. In order to hedge the net assets of foreign operations, borrowings are generally in the same currency as the underlying investment. The Group aims to hedge a reasonable proportion of its non-sterling assets in this way.
It is our policy not to hedge currency translation through foreign exchange contracts or currency swaps.
Average and year end sterling rates for major currencies which are significant to the Group were: |
|
| |
|
|
| |
| |
|
|
At 31 |
| |
Average |
December |
| |
2003 |
2002 |
2003 |
2002 |
| US dollar |
1.64 |
1.50 |
1.79 |
1.61 |
| Australian dollar |
2.53 |
2.78 |
2.38 |
2.86 |
| Czech koruna |
46.20 |
49.16 |
45.97 |
48.42 |
|
|
| |
|
|
| |
Currency transaction exposure
This arises where a business unit makes actual sales and purchases in a currency other than its functional currency. Transaction exposure also arises on the remittance from overseas of dividends or surplus funds. The Group's policy is to match transaction exposure where possible, and hedge remaining transactions as soon as they are committed, by using foreign currency contracts and similar instruments.
Short-term deposits
Surplus funds are placed for short periods in investments that carry low credit risk and are readily realisable in major currencies.
Interest rate risk
The Group's policy is to fix interest rates for a significant portion of the debt (82% as at 31 December 2003) using forward rate or interest rate swap agreements. Significant interest rate management programmes and instruments require specific approval of the Board. The weighted average interest of the fixed rate debt was 7%. Where project finance is utilised, our policy is to align the maturity of the debt with the contractual terms of the customer off-take agreement.
Counterparty credit risk
The Group's policy is to manage its credit exposure to trading and financial counterparties within clearly defined limits. Energy trading activities are strictly monitored and controlled through delegated authorities and procedures, which include specific criteria for the management of counterparty credit exposures in each of our key regions. Counterparty exposure via customer off-take agreements is monitored and managed by the local asset team with assistance from Group treasury where appropriate. In addition, Group treasury manages the Group-wide counterparty credit exposure on a consolidated basis, with the active and close involvement of the Global Risk Manager. Financial counterparty credit exposure is limited to relationship banks and commercial paper with companies which have strong investment grade credit ratings. |
|
| |
|
|
| |
|
|
| |
|
|
|
Critical accounting policies and estimates
We prepare our consolidated financial statements in
accordance with accounting principles generally accepted
in the UK. As such, we are required to make certain
estimates, judgements and assumptions that we believe
are reasonable based upon the information available.
These estimates and assumptions affect the reported
amounts of assets and liabilities at the date of the
financial statements; the reported amounts of revenues
and expenses during the periods presented and the
related disclosure of contingent assets and liabilities.
On an ongoing basis, we evaluate our estimates using
historical experience, consultation with experts and other
methods considered reasonable in the particular
circumstances to ensure full compliance with UK GAAP
and best practice. Actual results may differ significantly
from our estimates, the effect of which is recognised in
the period in which the facts that give rise to the revision
become known.
Our Group accounting policies are detailed on pages
67 and 68. The table below identifies the areas where
significant judgements are required, normally due to
the uncertainties involved in the application of certain
accounting policies.
Of the accounting policies identified in the table a
discussion follows on the policies we believe to be the
most critical in considering the impact of estimates and
judgements on the Group's financial position and results
of operations.
Fixed asset valuation
Tangible fixed assets
The original cost of greenfield-developed assets includes
relevant borrowing and development costs:- Interest on borrowings relating to major capital projects
with long periods of development is capitalised during
construction and written-off as part of the total cost
over the useful life of the asset.
- Project development costs (including appropriate
direct internal costs) are capitalised from the point
that it is virtually certain that the project will proceed
to completion.
|
|
| |
|
|
| |
|
|
Accounting policy |
Judgements/uncertainties affecting application |
|
|
|
|
|
|
|
|
|
|
|
|
|
|
|
|
|
|
|
Fixed asset valuation |
Determination of trigger events indicating impairment
and measurement of fair value using projected cash flows,
together with risk adjusted discount rates, or other more
appropriate methods of valuation. |
|
|
|
|
|
|
|
Consolidation policy – trade investments,
associates, joint ventures and subsidiaries |
Determination of the extent of influence the Group has
over the operations and strategic direction of entities in
which it holds an equity stake. |
|
|
|
|
|
|
|
Liquidated damages |
Determination of the appropriate accounting treatment
of receipts from contractors. |
|
|
|
|
|
|
|
Exceptional items |
Determination of the transactions or events which require
separate disclosure as exceptional items. |
|
|
|
|
|
|
|
Tax provisions |
Determination of appropriate provisions for taxation,
taking into account anticipated decisions of tax authorities. |
|
|
|
|
|
|
|
|
Assessment of the ability to utilise tax benefits through
future earnings. |
|
|
|
|
|
|
|
|
| |
|
|
| |
|
|
| |
|
|
|
 |
| |
| |
Depreciation of plants is charged so as to write down the
assets to their residual value over their estimated useful lives.
- Gas turbines and related equipment are depreciated
over 30 years to a 10% residual value, unless the
circumstances of the project or life of specific
components indicate a shorter period or a lower
residual value.
- Coal plant is considered on an individual basis.
Tangible fixed assets and fixed asset investments
Management regularly considers whether there are any
indications of impairment to carry values of fixed assets
or investments (e.g. the impact of current adverse market
conditions). Impairment reviews are generally based on
risk adjusted discounted cash flow projections that
inevitably require estimates of discount rates and future
market prices over the remaining lives of the assets. |
|
| |
|
|
|
|
| |
| |
Consolidation policy - significant influence
The determination of the level of influence the Group
has over a business is often a mix of contractually
defined and subjective factors that can be critical to
the appropriate accounting treatment of entities in
the consolidated accounts.
We achieve influence through Board representation and
by obtaining rights of veto over significant actions. We
generally treat investments where the Group holds less
than 20% of the equity as trade investments. Trade
investments are carried in the balance sheet at cost less
amounts written off. Income is recorded as earned only
on the receipt of dividends from the investment.
Where the Group owns between 20% and 50% of
the equity and has significant influence over the entity's
operating and financial policies, we generally treat the
entity as an associated undertaking or joint venture.
Equally, where the Group holds a substantial interest (but
less than 20%) in an entity and is able to exert significant
influence over its operations, we treat it as an associated
undertaking or joint venture. Conversely, although we
generally treat a holding of more than 20% of the equity
as an associated undertaking or joint venture, where the
Group is unable to exert significant influence over the
operations of the entity, we treat it as a trade investment. |
|
| |
|
|
|
|
| |
| |
Associated undertakings and joint ventures are accounted
for using the equity method of accounting, which involves
including the Group's share of operating profit, interest
and tax on the respective lines of the profit and loss
account, and the Group's share of net assets within
the fixed asset investments caption in the balance sheet.
In addition, we provide voluntary disclosure of the
amount of net debt held by these entities, although
in accordance with UK GAAP, this net debt is not
included in the consolidated balance sheet.
The Group generally consolidates entities in which it
holds in excess of 50% of the equity and where it exerts
control over the strategic direction of the entity. However,
if the Group were to hold in excess of 50% of the equity
but was unable to exert dominant influence over the
strategic direction or operations of the entity, we would
account for the entity as an associated undertaking or
joint venture.
Liquidated damages
The Group receives amounts from contractors in
respect of the late commissioning and under
performance of new power plants. The receipts that
relate to compensation for lost revenue are treated as
revenue when the compensation is due and payable by
the contractor. Those receipts that relate to compensation
for plants not achieving long-term performance levels
specified in the original contracts are recorded as a
reduction in the cost of the assets.
Exceptional items
An item is considered exceptional if it derives from
ordinary activities and is considered of such significance
that separate disclosure is needed if the financial
statements are to give a true and fair view. All exceptional
items, other than those listed below are included under
the statutory line-item to which they relate. In addition,
separate disclosure on the face of the profit and loss
account is required for the following items:
- profits or losses on the sale or termination of
an operation;
- costs of a fundamental re-organisation or restructuring
having a material effect on the nature and focus of the
Company's operations;
profits or losses on the disposal of fixed assets.
Determining which transactions are to be considered
exceptional in nature is often a subjective matter. |
|
| |
|
|
|
|
| |
| |
Preparing for the conversion to International Financial Reporting Standards (IFRS)
For reporting periods beginning on or after 1 January
2005, the consolidated accounts of the Group must
comply with IFRS.
The Group has developed a conversion plan to assess
the potential impact of IFRS and to determine a clear
path forward that is cost effective, minimises disruption
to the business and ensures ongoing communication of
the impact of IFRS on our performance targets. We have
reviewed and assessed the impact of accounting literature
expected to be effective on the date of transition to IFRS
and will continue to monitor and assess the impact of
any further pronouncements issued by the International
Accounting Standards Board (IASB).
The principal areas expected to be impacted by the
transition to IFRS are as follows:
- presentation of primary financial statements;
- recognition of derivatives and financial instruments;
- accounting for goodwill on acquisitions;
- accounting for employee benefits (pensions and
share-based payments);
- accounting for joint ventures, associates and
trade investments.
|
|
| |
|
|
| |
|
|
| |
|
|
|
|